Detector Footprints
In this tutorial we look at the basics of specifying detector footprints. Detector footprints provide templates for filtering which objects are seen in a given pointing. As such we will need to provide both the information about the query point and the survey pointing itself.
Detector footprints are defined by AstroPy regions.
[1]:
import matplotlib.pyplot as plt
import numpy as np

from astropy import units as u
from astropy.coordinates import SkyCoord
from regions import CirclePixelRegion, PixCoord, RectanglePixelRegion, RectangleSkyRegion

from lightcurvelynx.astro_utils.detector_footprint import DetectorFootprint
DetectorFootprint Class
The DetectorFootprint class is a wrapper around the AstroPy region that handles data validation, handles transformations, and provides helper functions. Most users will not need to work with the DetectorFootprint directly as the wrapping will be handled automatically by the ObsTable.
We start by defining a rectangular footprint with a width of 2 degrees and a height of 1 degree. In addition to the shape information, the user needs to pass in either the wcs or pixel scale (in arcseconds per pixel).
[2]:
center = SkyCoord(ra=0.0, dec=0.0, unit="deg", frame="icrs")
rect_region = RectangleSkyRegion(center=center, width=2.0 * u.deg, height=1.0 * u.deg, angle=0.0 * u.deg)

fp = DetectorFootprint(rect_region, pixel_scale=10.0)
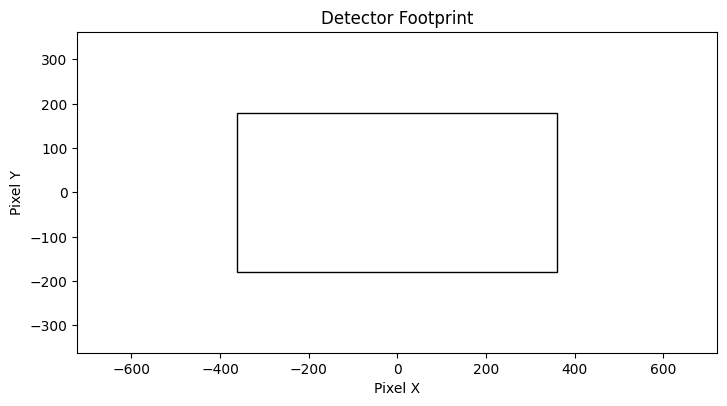
Plotting
We can plot the footprint with the plot command. This plots the footprint of the detector in pixel space.
[3]:
fp.plot()
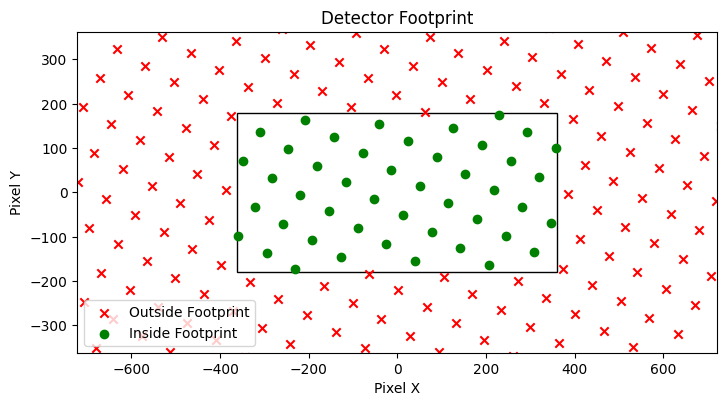
In many cases users will be interested in seeing the footprint in the context of points on the sky. Since the footprint itself is defined without respect to position on the sky, we have to pass in the detector’s location (center RA, center dec, and rotation) as well as the sample points we want to include.
Let’s look at a rectangular detector centered on RA=20.0 and dec=10.0 with a 30 degree clockwise rotation.
[4]:
ra_points = []
dec_points = []
for ra in np.linspace(18, 22, 20):
    for dec in np.linspace(8, 12, 20):
        ra_points.append(ra)
        dec_points.append(dec)
ra_points = np.array(ra_points)
dec_points = np.array(dec_points)

ax = fp.plot(
    center_ra=20.0,
    center_dec=10.0,
    rotation=30.0,
    point_ra=ra_points,
    point_dec=dec_points,
)
Querying
The code uses the same notation for querying whether a point is within the footprint. Unlike plotting, we might which to query multiple pointings (with different center locations and rotations) at once. The contains function can take a vector of center points and rotations. All arrays must be the same length.
[5]:
# The query points alternate between (20, 10) and (25, 10).
query_ra = np.array([20.0, 25.0, 20.0, 25.0])
query_dec = np.array([10.0, 10.0, 10.0, 10.0])

# The survey pointings alternate between (20, 10) and (10, 10).
# No rotation is applied.
pointing_ra = np.array([20.0, 20.0, 10.0, 10.0])
pointing_dec = np.array([10.0, 10.0, 10.0, 10.0])

contains = fp.contains(query_ra, query_dec, pointing_ra, pointing_dec)
print(contains)
[ True False False False]
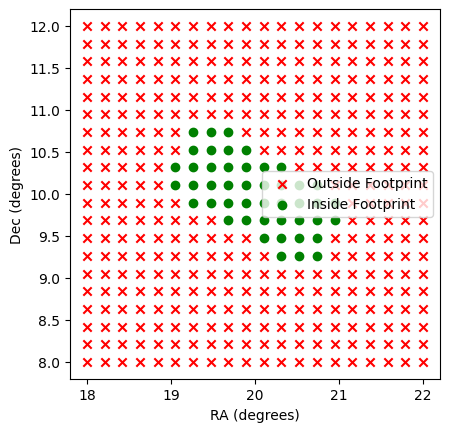
As we see the first point falls within the footprint, but the remaining points do not. Let’s look again at our rectangular detector centered on RA=20.0 and dec=10.0 with a 30 degree clockwise rotation.
[6]:
ax = plt.subplot(111)

# Use the footprints to label the points.
inside = fp.contains(
    ra_points,
    dec_points,
    center_ra=20.0,
    center_dec=10.0,
    rotation=30.0,
)

ax.scatter(ra_points[~inside], dec_points[~inside], color="red", marker="x", label="Outside Footprint")
ax.scatter(ra_points[inside], dec_points[inside], color="green", marker="o", label="Inside Footprint")
ax.legend()
ax.set_xlabel("RA (degrees)")
ax.set_ylabel("Dec (degrees)")
ax.set_aspect("equal")

plt.show()
SkyRegions
The DetectorFootprint class comes with built in functions for computing the SkyRegion for given pointings (RA, dec) and optional rotation.
[7]:
sky_region, sky_wcs = fp.compute_sky_region(center_ra=20.0, center_dec=10.0, rotation=30.0)

# Check that the same points are inside and outside the SkyRegion.
test_coords = SkyCoord(ra=ra_points, dec=dec_points, unit="deg", frame="icrs")
inside2 = sky_region.contains(test_coords, sky_wcs)
assert np.array_equal(inside, inside2)
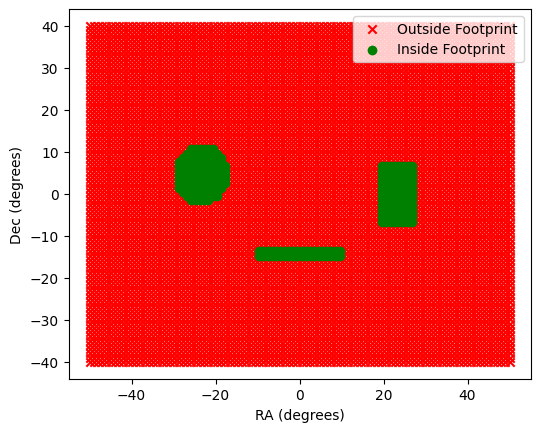
More Complex Detectors
The DetectorFootprint class can support any region that can be represented as a AstroPy Region. Let’s consider the union of two shapes.
[8]:
region1 = RectanglePixelRegion(center=PixCoord(x=-50, y=0), width=20, height=31, angle=0.0 * u.deg)
region2 = CirclePixelRegion(center=PixCoord(x=50, y=10), radius=15)
region3 = RectanglePixelRegion(center=PixCoord(x=0, y=-30), width=41, height=5, angle=0.0 * u.deg)
combined_region = region1 | region2 | region3

fp_combined = DetectorFootprint(combined_region, pixel_scale=0.5 * 3600.0)
[9]:
ra_points = []
dec_points = []
for ra in np.linspace(-50, 50, 100):
    for dec in np.linspace(-40, 40, 80):
        ra_points.append(ra)
        dec_points.append(dec)
ra_points = np.array(ra_points)
dec_points = np.array(dec_points)

ax = plt.subplot(111)

# Use the footprints to label the points.
inside = fp_combined.contains(
    ra_points,
    dec_points,
    center_ra=0.0,
    center_dec=0.0,
)

ax.scatter(ra_points[~inside], dec_points[~inside], color="red", marker="x", label="Outside Footprint")
ax.scatter(ra_points[inside], dec_points[inside], color="green", marker="o", label="Inside Footprint")
ax.legend()
ax.set_xlabel("RA (degrees)")
ax.set_ylabel("Dec (degrees)")
ax.set_aspect("equal")