Advanced Parameter Sampling
This tutorial builds off the “Sampling Parameters” notebook to describe how to implement more complex dependencies between parameters.
Core Concepts
In the “Sampling Parameters” notebook, we introduced a few core concepts that will be heavily used throughout this notebook and are worth reviewing:
A parameter is effectively a variable in the mathematical equations that is instantiated during a round of sampling. A simple model might contain a handful of parameters for everything from position on the sky (RA, Dec) to inherent physical quantities (hostmass) to purely functional parameters (curve decay rate).
A
ParameterizedNodeis a computational unit for working with parameters. These nodes provide the code that defines the recipe for computing its own parameters. These nodes may use inputs that are parameters computed within other nodes.A
GraphStateis a data structure that holds the sampled values for all the parameters in the model. EachParameterizedNodeobject is stateless and does not store information about the parameters themselves. Instead all operations take aGraphStatethat contains the necessary input parameters and will store the corresponding output parameters.
The combined values of all the parameters in the graph define a single sample of the model’s parameters.
Basic Chaining
We can use one ParameterizedNode object to provide parameters for another object. As described in the previous notebook, this chaining can use the output of a node as the input to another node:
[1]:
import numpy as np

from lightcurvelynx.math_nodes.np_random import NumpyRandomFunc
from lightcurvelynx.models.basic_models import ConstantSEDModel

# Define a brightness distribution and create a ConstantSEDModel that samples from it.
brightness_dist = NumpyRandomFunc("normal", loc=20.0, scale=2.0, node_label="brightness_dist")
model = ConstantSEDModel(brightness=brightness_dist, node_label="test")
state = model.sample_parameters(num_samples=10)
print(state["test"]["brightness"])
[21.46951879 18.9850899  18.91625781 21.47596796 19.34308171 23.33864289
 19.69017313 21.06439842 21.16025824 21.67877381]
/home/docs/checkouts/readthedocs.org/user_builds/lightcurvelynx/envs/latest/lib/python3.12/site-packages/tqdm/auto.py:21: TqdmWarning: IProgress not found. Please update jupyter and ipywidgets. See https://ipywidgets.readthedocs.io/en/stable/user_install.html
  from .autonotebook import tqdm as notebook_tqdm
In this example, the value of the object’s brightness parameter is taken from the output of the brightness_dist node. Since that node is generating samples from a normal distribution, the object’s brightness is being sampled as a normal distribution.
We can also reference another node’s parameter using the dot notation. For example, if we want to access the host’s position information we could use “.ra” and “<host_object.dec>”:
[2]:
ra_node = NumpyRandomFunc("uniform", low=0.0, high=360.0)
host = ConstantSEDModel(brightness=15.0, ra=ra_node, dec=2.0, node_label="host")
source = ConstantSEDModel(brightness=10.0, ra=host.ra, dec=host.dec, node_label="source")
state = source.sample_parameters(num_samples=10)
for i in range(10):
    print(
        f"Sample {i + 1}: Host RA = {state['host']['ra'][i]:.2f}, Source RA = {state['source']['ra'][i]:.2f}"
    )
Sample 1: Host RA = 250.01, Source RA = 250.01
Sample 2: Host RA = 160.49, Source RA = 160.49
Sample 3: Host RA = 9.64, Source RA = 9.64
Sample 4: Host RA = 134.94, Source RA = 134.94
Sample 5: Host RA = 64.93, Source RA = 64.93
Sample 6: Host RA = 161.65, Source RA = 161.65
Sample 7: Host RA = 284.02, Source RA = 284.02
Sample 8: Host RA = 220.25, Source RA = 220.25
Sample 9: Host RA = 30.75, Source RA = 30.75
Sample 10: Host RA = 263.13, Source RA = 263.13
When a parameter is assigned from another node using the dot notation, the user is telling the code to link the parameters. When the host samples a new value for RA, it is automatically passed along to the source.
Sampling from Known Values
LightCurveLynx provides multiple ParameterizedNode subclasses for selecting known values in math_nodes/given_sampler.py. These can be used for testing, allowing a user to input different (but known) values for each sample. As we will see later in this notebook, they can also be combined with other node types to do more complex computations.
BinarySampler
The BinarySampler node returns a single True or False value for each sample. This is specifically designed for is probabilistically applying effects or making decisions in the simulation.
[3]:
from lightcurvelynx.math_nodes.given_sampler import BinarySampler

apply_effect = BinarySampler(0.25, node_label="apply_effect")
states = apply_effect.sample_parameters(num_samples=5000)

num_true = np.count_nonzero(states["apply_effect"]["function_node_result"])
print(f"Returned {num_true} TRUE and {5000 - num_true} FALSE")
Returned 1238 TRUE and 3762 FALSE
GivenValueList
The GivenValueList node returns the values from a given list (in the order in which they are given). This is primarily used for testing:
[4]:
from lightcurvelynx.math_nodes.given_sampler import GivenValueList

brightness_dist = GivenValueList([18.0, 20.0, 22.0, 25.0])
model = ConstantSEDModel(brightness=brightness_dist, node_label="test")
state = model.sample_parameters(num_samples=3)
print(state["test"]["brightness"])
[18. 20. 22.]
The GivenValueList is the only stateful parameterized node. For testing purposes if you query the node multiple times, it will give the next unsampled items from the list.
[5]:
state = model.sample_parameters(num_samples=1)
print(state["test"]["brightness"])
25.0
Because it is stateful, the GivenValueList does not support parallel execution. The simulation will fail with an error if a GivenValueList is used.
GivenValueSampler
The GivenValueSampler node returns a random value (with replacement) from a given list:
[6]:
from lightcurvelynx.math_nodes.given_sampler import GivenValueSampler

brightness_dist = GivenValueSampler([18.0, 20.0, 22.0])
model = ConstantSEDModel(brightness=brightness_dist, node_label="test")
state = model.sample_parameters(num_samples=10)
print(state["test"]["brightness"])
[18. 22. 20. 20. 20. 20. 20. 18. 18. 20.]
The node can also take a list of weights to sample from different distributions.
[7]:
brightness_dist = GivenValueSampler([18.0, 20.0, 22.0], weights=[0.5, 0.3, 0.2])
model = ConstantSEDModel(brightness=brightness_dist, node_label="test")
state = model.sample_parameters(num_samples=1000)
print("Brightness 18:", np.count_nonzero(state["test"]["brightness"] == 18.0))
print("Brightness 20:", np.count_nonzero(state["test"]["brightness"] == 20.0))
print("Brightness 22:", np.count_nonzero(state["test"]["brightness"] == 22.0))
Brightness 18: 480
Brightness 20: 331
Brightness 22: 189
We can also provide a single integer value N to sample from the range [0, N-1].
[8]:
brightness_dist = GivenValueSampler(10)
model = ConstantSEDModel(brightness=brightness_dist, node_label="test")
state = model.sample_parameters(num_samples=1000)
for i in range(5):
    print(f"Brightness {i}:", np.count_nonzero(state["test"]["brightness"] == i))
Brightness 0: 91
Brightness 1: 100
Brightness 2: 110
Brightness 3: 94
Brightness 4: 101
This is useful when sampling indices of other lists (see the example in the “Combining Node Types” section below).
GivenValueSelector
The GivenValueSelector node takes a single input parameter index and uses that to lookup the parameter’s value from a given list. Which item is selected is determined by the GivenValueSelector’s index parameter. If we sample the index from a given distribution we can sample items for the list.
Below we use a constant value for index so we return the same element each time:
[9]:
from lightcurvelynx.math_nodes.given_sampler import GivenValueSelector

brightness_dist = GivenValueSelector([18.0, 20.0, 22.0], index=2)
model = ConstantSEDModel(brightness=brightness_dist, node_label="test")
state = model.sample_parameters(num_samples=10)
print(state["test"]["brightness"])
[22. 22. 22. 22. 22. 22. 22. 22. 22. 22.]
At first glance, the GivenValueSelector node may appear redundant with the GivenValueSampler node. After all, both nodes are selecting a value from a list. However, as we will see in the next section, the power of these nodes comes from when they are used together to sample consistently from multiple lists.
Combining Node Types
We can perform complex sampling operations by combining multiple types of nodes. For example, imagine that we wanted to sample from a list of known objects where we have a list of the RAs, decs, brightness, and redshifts. We can combine a random selection of the object’s index (by sampling a index parameter) with nodes that look up the value for that object index in each of the corresponding lists:
[10]:
ra_list = [10.0, 20.0, 30.0, 40.0, 50.0]
dec_list = [1.0, 2.0, 3.0, 4.0, 5.0]
brightness_list = [15.0, 16.0, 17.0, 18.0, 19.0]

index_dist = GivenValueSampler(5)  # Samples indices 0 to 4 uniformly

# Use the same sampled index for ra, dec, and brightness.
model = ConstantSEDModel(
    brightness=GivenValueSelector(brightness_list, index=index_dist),
    ra=GivenValueSelector(ra_list, index=index_dist),
    dec=GivenValueSelector(dec_list, index=index_dist),
    node_label="model",
)

state = model.sample_parameters(num_samples=10)
for i in range(10):
    ra = state["model"]["ra"][i]
    dec = state["model"]["dec"][i]
    brightness = state["model"]["brightness"][i]
    print(f"Sample {i + 1}: ({ra}, {dec}) = {brightness}")
Sample 1: (10.0, 1.0) = 15.0
Sample 2: (30.0, 3.0) = 17.0
Sample 3: (40.0, 4.0) = 18.0
Sample 4: (40.0, 4.0) = 18.0
Sample 5: (40.0, 4.0) = 18.0
Sample 6: (20.0, 2.0) = 16.0
Sample 7: (40.0, 4.0) = 18.0
Sample 8: (10.0, 1.0) = 15.0
Sample 9: (50.0, 5.0) = 19.0
Sample 10: (50.0, 5.0) = 19.0
The GivenValueSampler node chooses an object index value from the range [0, 5). The output of this node (the index) is passed as the input to multiple GivenValueSelector nodes to extract the corresponding element from each of the lists.
Any important consideration is that each node in the graph is only sampled once. This means a single index is chosen and used for all three lists. For each sample, the value of all parameters (RA, Dec, and brightness) will be consistent for a single object.
For other examples of how these types of nodes can be combined, see the implementation of the MultiLightcurveTemplateModel and the RandomMultiObjectModel models.
Sampling from Tables
Instead of lists, we might want to extract values from tabular data represented as an a dictionary, AstroPy Table, or Pandas Dataframe. The TableSampler node will sampling a row from given tabular data and store a unique parameter for each column of the table.
For example we can create a table columns ‘A’, ‘B’, and ‘C’ and sample from those:
[11]:
from astropy.table import Table

from lightcurvelynx.math_nodes.given_sampler import TableSampler

raw_data_dict = {
    "A": [1, 2, 3, 4, 5, 6, 7, 8],
    "B": [2, 3, 4, 5, 4, 3, 2, 1],
    "C": [3, 4, 5, 6, 7, 8, 9, 10],
}
data = Table(raw_data_dict)

table_node = TableSampler(data, in_order=True, node_label="node")
state = table_node.sample_parameters(num_samples=3)
print(state)
node:
    A: [1 2 3]
    B: [2 3 4]
    C: [3 4 5]
The in_order flag tells the node whether to extract the rows in order (True) or randomly with replacement (False). Note that the TableSampler is not stateful. If called multiple times (with in_order=True), it will return the first N rows from the table each time. It will also produce a warning for the user.
[12]:
state = table_node.sample_parameters(num_samples=3)
print(state)
node:
    A: [1 2 3]
    B: [2 3 4]
    C: [3 4 5]
/home/docs/checkouts/readthedocs.org/user_builds/lightcurvelynx/envs/latest/lib/python3.12/site-packages/lightcurvelynx/math_nodes/given_sampler.py:370: UserWarning: TableSampler in_order sampling called multiple times with the same sample_offset. This may indicate unintended behavior, because the same parameter values are used multiple times instead of iterating over the table. Consider to set different sample_offset values for different objects or chunks.
  warnings.warn(
If users want to perform multiple sequential simulations using different parts of the table, then they will need to use the sample_offset parameter.
[13]:
state = table_node.sample_parameters(num_samples=3, sample_offset=3)
print(state)
node:
    A: [4 5 6]
    B: [5 4 3]
    C: [6 7 8]
However, most users should not need to ever set sample_offset directly. If you are running a parallelized simulation, the software sets and uses this value behind the scenes to ensure that every worker is operating on a different part of the table.
As with other node types, we can use the dot notation to use these values as input for other models. For example, let’s assume that the ‘B’ column corresponds to Brightness, ‘A’ corresponds to RA, and ‘C’ is not used.
[14]:
table_node = TableSampler(data, in_order=False, node_label="node")
model = ConstantSEDModel(
    brightness=table_node.B,
    ra=table_node.A,
    node_label="test",
)

state = model.sample_parameters(num_samples=10)
print(state)
NumpyRandomFunc:integers_2:
    low: [0 0 0 0 0 0 0 0 0 0]
    high: [8 8 8 8 8 8 8 8 8 8]
    function_node_result: [0 0 5 4 2 4 2 6 6 5]
node:
    selected_table_index: [0 0 5 4 2 4 2 6 6 5]
    A: [1 1 6 5 3 5 3 7 7 6]
    B: [2 2 3 4 4 4 4 2 2 3]
    C: [3 3 8 7 5 7 5 9 9 8]
test:
    ra: [1 1 6 5 3 5 3 7 7 6]
    dec: [None None None None None None None None None None]
    redshift: [None None None None None None None None None None]
    t0: [None None None None None None None None None None]
    distance: [None None None None None None None None None None]
    brightness: [2 2 3 4 4 4 4 2 2 3]
Statistical Distributions
Basic (Numpy) Distributions
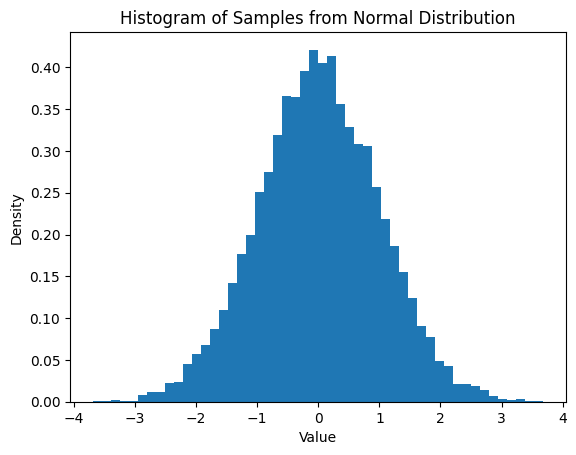
The NumpyRandomFunc node allows users to sample from most simple distributions supported by numpy, such as uniform or normal. The node’s constructor takes the name of the numpy function and then any parameters as keyword arguments.
In the following cell we generate 10,000 samples from a normal distribution with mean=0.0 and standard deviation=1.0.
[15]:
import matplotlib.pyplot as plt

normal_dist = NumpyRandomFunc("normal", loc=0.0, scale=1.0, node_label="normal_dist")
samples = normal_dist.sample_parameters(num_samples=10000)
plt.hist(samples["normal_dist"]["function_node_result"], bins=50, density=True)
plt.title("Histogram of Samples from Normal Distribution")
plt.xlabel("Value")
plt.ylabel("Density")
plt.show()
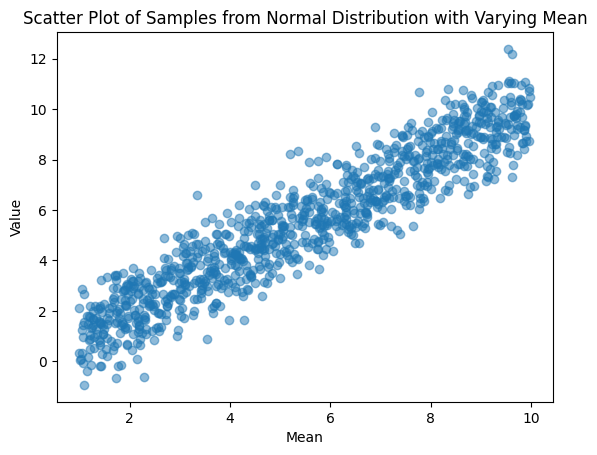
The keyword arguments for the NumpyRandomFunc can be chained to take other parameters themselves. In following example, we generate an x value for each row uniformly [1, 10]. Then we use that x value to set the mean of the normal distribution for that row.
[16]:
x_dist = NumpyRandomFunc("uniform", low=1.0, high=10.0, node_label="mean_dist")
normal_dist = NumpyRandomFunc("normal", loc=x_dist, scale=1.0, node_label="normal_dist")
samples = normal_dist.sample_parameters(num_samples=1_000)

plt.scatter(
    samples["mean_dist"]["function_node_result"], samples["normal_dist"]["function_node_result"], alpha=0.5
)
plt.xlabel("Mean")
plt.ylabel("Value")
plt.title("Scatter Plot of Samples from Normal Distribution with Varying Mean")
plt.show()
Combining Distributions
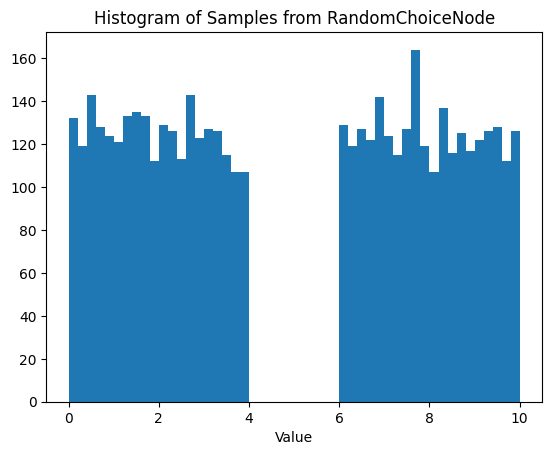
There are plenty of times you might want to move beyond the simple numpy sampling functions. For example, a user might want to generate numbers uniformly from the union of ranges [0, 4] U [6, 10]. We can do this by chaining nodes. Here we use a RandomChoiceNode (will be introduced in v0.4.2) to pick the distribution.
[17]:
from lightcurvelynx.math_nodes.random_choice import RandomChoiceNode

input1 = NumpyRandomFunc("uniform", low=0, high=4, node_label="input1")
input2 = NumpyRandomFunc("uniform", low=6, high=10, node_label="input2")
choice_node = RandomChoiceNode([input1, input2], node_label="choice_node")

sampled_state = choice_node.sample_parameters(num_samples=5_000)
results = sampled_state["choice_node"]["function_node_result"]

plt.hist(results, bins=50)
plt.title("Histogram of Samples from RandomChoiceNode")
plt.xlabel("Value")
plt.show()